Biosphere-Atmosphere Gas Exchange & Atmospheric Chemistry Group

Keywords: Photochemical air pollution, atmospheric chemistry modeling, eddy covariance, ozone, BVOCs,
vegetation, seawater, evapotranspiration, micrometeorology
Ozone dry deposition mechanisms under warm and dry conditions and coastal effects
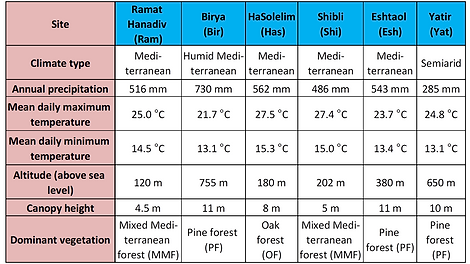
Field measurements were carried out at six measurement sites with different vegetation in Israel, ~3–59 km from the Eastern Mediterranean coast along the Israel climate gradient (ICG). The ICG is characterized by a general decrease in precipitation amount and increased dryness from humid Mediterranean in northern Israel, to semiarid and arid in southern Israel, along with generally high daily temperatures (see Table below). Three of the sites, Yatir forest (Yat), Eshtaol forest (Esh) and Birya forest (Bir), are predominantly covered by planted pine forest, but exposed to semiarid, Mediterranean and humid Mediterranean climate, respectively, whereas, Ramat Handiv (Ram) shrubery and Beit Keshet forest (Shi) are predominantly covered by mixed-Mediterranean vegetation and HaSolelim forest is predominantly covered by oak.

Location and satellite image of the six measurement sites. The left panel shows the locations of the sites on a large-scale map. The right panel zooms in to show the names of each site. The colors of the site's symbol present the type of climate at the site.
-
Response of ozone non-stomatal conductance to relative humidity and air temperature

2
An example using measurements that took place in Ramat Hanadiv. It presents bin-based averaging of Gns vs. RH, and the corresponding non-linear exponential fitting curve (exp) and hyperbolic non-linear fitting curve (hyp), and the corresponding non-linear regression coefficient of determination (r ), individually for daytime (orange) and nighttime (blue). Vertical bars represent standard error of the mean, associated with each bin.

The response of non-stomatal O3 conductance (Gns) to changes in air temperature (T) and relative humidity (RH). Presented are the exponential regression slope coefficient (ERSC) for the bin-based regression between Gns vs. T (left panels) and RH (right panels) during the day (upper panels) and at night (lower panels). Different sites (Bir, Birya; Shi, Shibli; Has, Hasolelim; Esh, Eshtaol; Yat, Yatir) are represented by different symbols. The filling color represents the regression's corresponding r value (see the color key in the figure). The dashed line represents the zero line of the slope. DOY, day of the year. Provided p values indicate the strong impact of RH on Rns (see (Li et al., 2019)). The figure demonstrates a significantly higher impact of RH vs. T on Rns under the warm and dry conditions.
2
-
Strong limitation on stomatal O3 flux under warm and dry conditions at the Eastern Mediterranean

The symbols style and color represent the sites and seasons, vertical and horizontal error bars stand for standard error of the mean and length of period, respectively. Bir, Esh, Has, Ram, Shi, Yat stand for Birya, Eshtaol, HaSolelim, Ramat Hanadiv, Shibli, Yatir measurement sites, respectively; PF, OF, and MMF stand for pine forest, oak forest, and mixed Mediterranean forest; Fst and Ftot are stomatal and total O3 flux, respectively.
The results have indicated a strong limitation of stomatal O3 flux (Fst) by drought under the studied conditions in the Eastern Mediterranean. This was most radical for Yat, the only site under semiarid conditions, where strong limitation on drought occurred from spring to early winter, corresponding with low minimum average Fst/total O3 flux (Ftot) of 8–11% during the summer (Li et al., 2019).
-
Upward ozone flux under extreme dryness induced by dry intrusion events


Time series of dry intrusion (DI) events with relative humidity (RH) and O3 total flux (Ftot) measurement. Upper panel, vertical profile at 31°N, 35°E of RH (shaded, %) and specific humidity (g kg-1, black contours) vs. time from ERA-Interim. The black dots mark the time and pressure level of DI trajectories that are present within a 1-degree distance from 31°N, 35°E. Lower panel, RH measurements at the height of 15 m above the surface and the Ftot, with the filled area (blue) marking RH< 25%, and filled areas (dark green) present positive Ftot, respectively. The shadowed area shows the synchronization between positive Ftot and extreme low RH caused by the DI events.
The figure indicates that when extremely dry conditions occur (RH<25%), induced by DIs (black dots), the surface resistance becomes so large that the O3 flux tends to be directed upwards. The figure also shows RH increases with height during the positive O3 flux events. The combined effect of high surface resistance and positive vertical humidity gradient appears to lead to these positive ozone flux events (Li et al., 2019).
-
Enhancement of ozone dry deposition by sea and land breezes and moisture transport


Ozone deposition rate (Vd,O3) during nighttime. Left panel, nighttime Vd,O3. Right panel, the ratio between nighttime and daytime Vd,O3. Different forest sites in Israel (BIR, Birya; SHI, Shibli; HAS, Hasolelim; ESH, Eshtaol; YAT; Yatir; RAM, Ramat Hanadiv) and seasons are represented by different symbols and colors, respectively. Vertical error bars represent standard error of the mean, and horizontal bars represent measurement duration. JD, median Julian day). The figure demonstrates a high ozone deposition rate during the night which was induced by the sea and land breezes (Li et al., 2019)

Linear regression slope coefficient (LRSC) value for the bin-based exponential regression between non-stomatal ozone conductance (Gns) vs friction velocity (u ) in the nighttime. Different sites and seasons are represented by different symbols and line colors, labeled with year. The filling color represents the r value as the legend shows. The dashed line is the zero line of the slope. DOY stands for the day of the year; Bir, Esh, Has, Shi, Yat stands for Birya, Eshtaol, HaSolelim, Shibli, Yatir measurement sites, respectively; PF, OF, and MMF stand for pine forest, oak forest, and mixed Mediterranean forest, respectively.
The figure demonstrates the strong impact of sea and land breezes on the nighttime ozone deposition rate, as reflected by the significant correlation between u and Gns (Li et al., 2019). The relatively strong nightmare deposition was also induced by the transport of moisture from the sea (Li et al., 2019).
*
2
*
-
The effect of NOX emission from elevated sources on ozone deposition rate


The analyses indicate that at Ramat Hanadiv NO emission from elevated sources can reduce O3-deposition rate to vegetation, highlighting the need to account for the NOs' and VOCs' vertical gradient, and/or vertical flux, at high resolution in any study of O3 deposition under the effects of anthropogenic pollution effects.
Presented is the evaluated χ (in %; represents the percentage of time for which an increase in NO led to a reduction in O3 deposition rate; see (Li et al., 2018) vs. six wind direction sectors, which correspond to air sampling downwind of the investigated fetch. The most significant impact of NOx on decreasing O3 deposition is associated with emission from the Hadera power plant (HPP) and Haifa bay industrial area (HBIA).